Premium · TradingView
Market Structure Radar
Choose which chart to review next. Radar compares the market structure of selected symbols in one table and ranks them by distance to levels for trend continuation or change.
Access is included in the monthly Paid Space subscription from Algorithms_ATS on TradingView.
Read the TradingView publicationPublication revision 1
BINANCE:BTCUSDT.P · 15 min
Candles · UTC+3 · 4 – 6 Oct 2026
Author snapshot ·
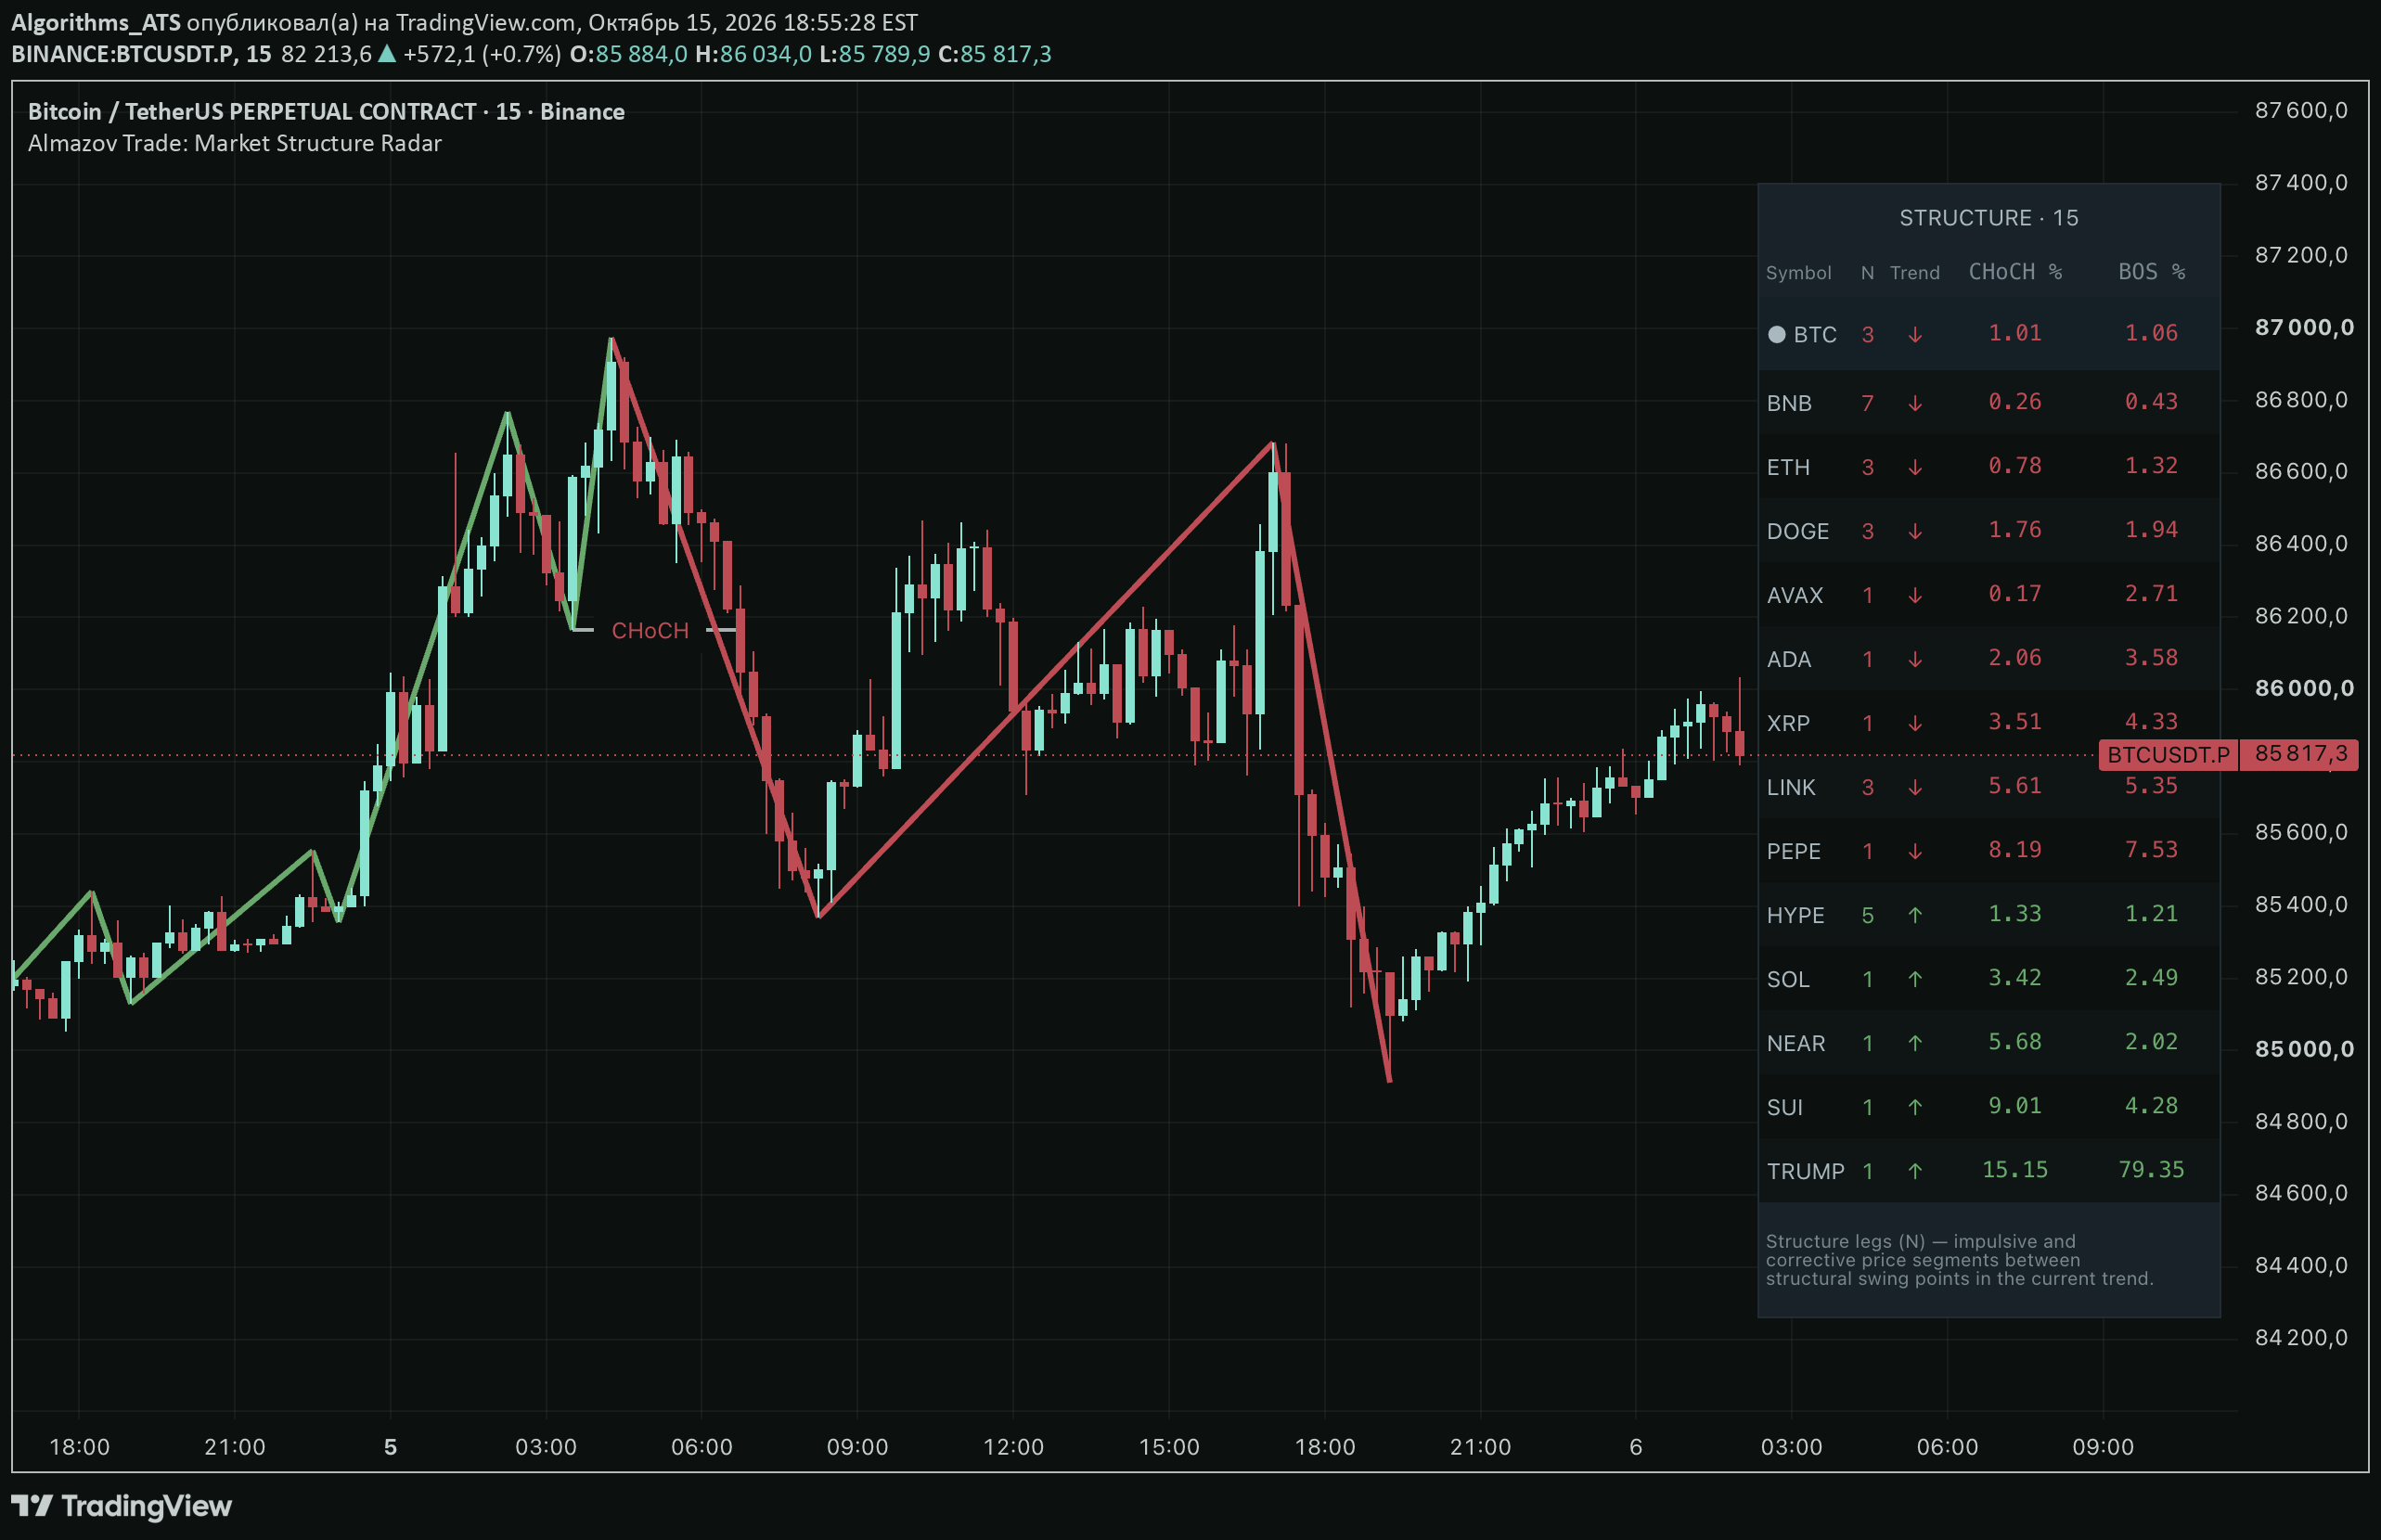
The red and green swing path sits beside the market table. Read each trend arrow, then compare the distances under CHoCH % and BOS %. The top row is the BTC chart.
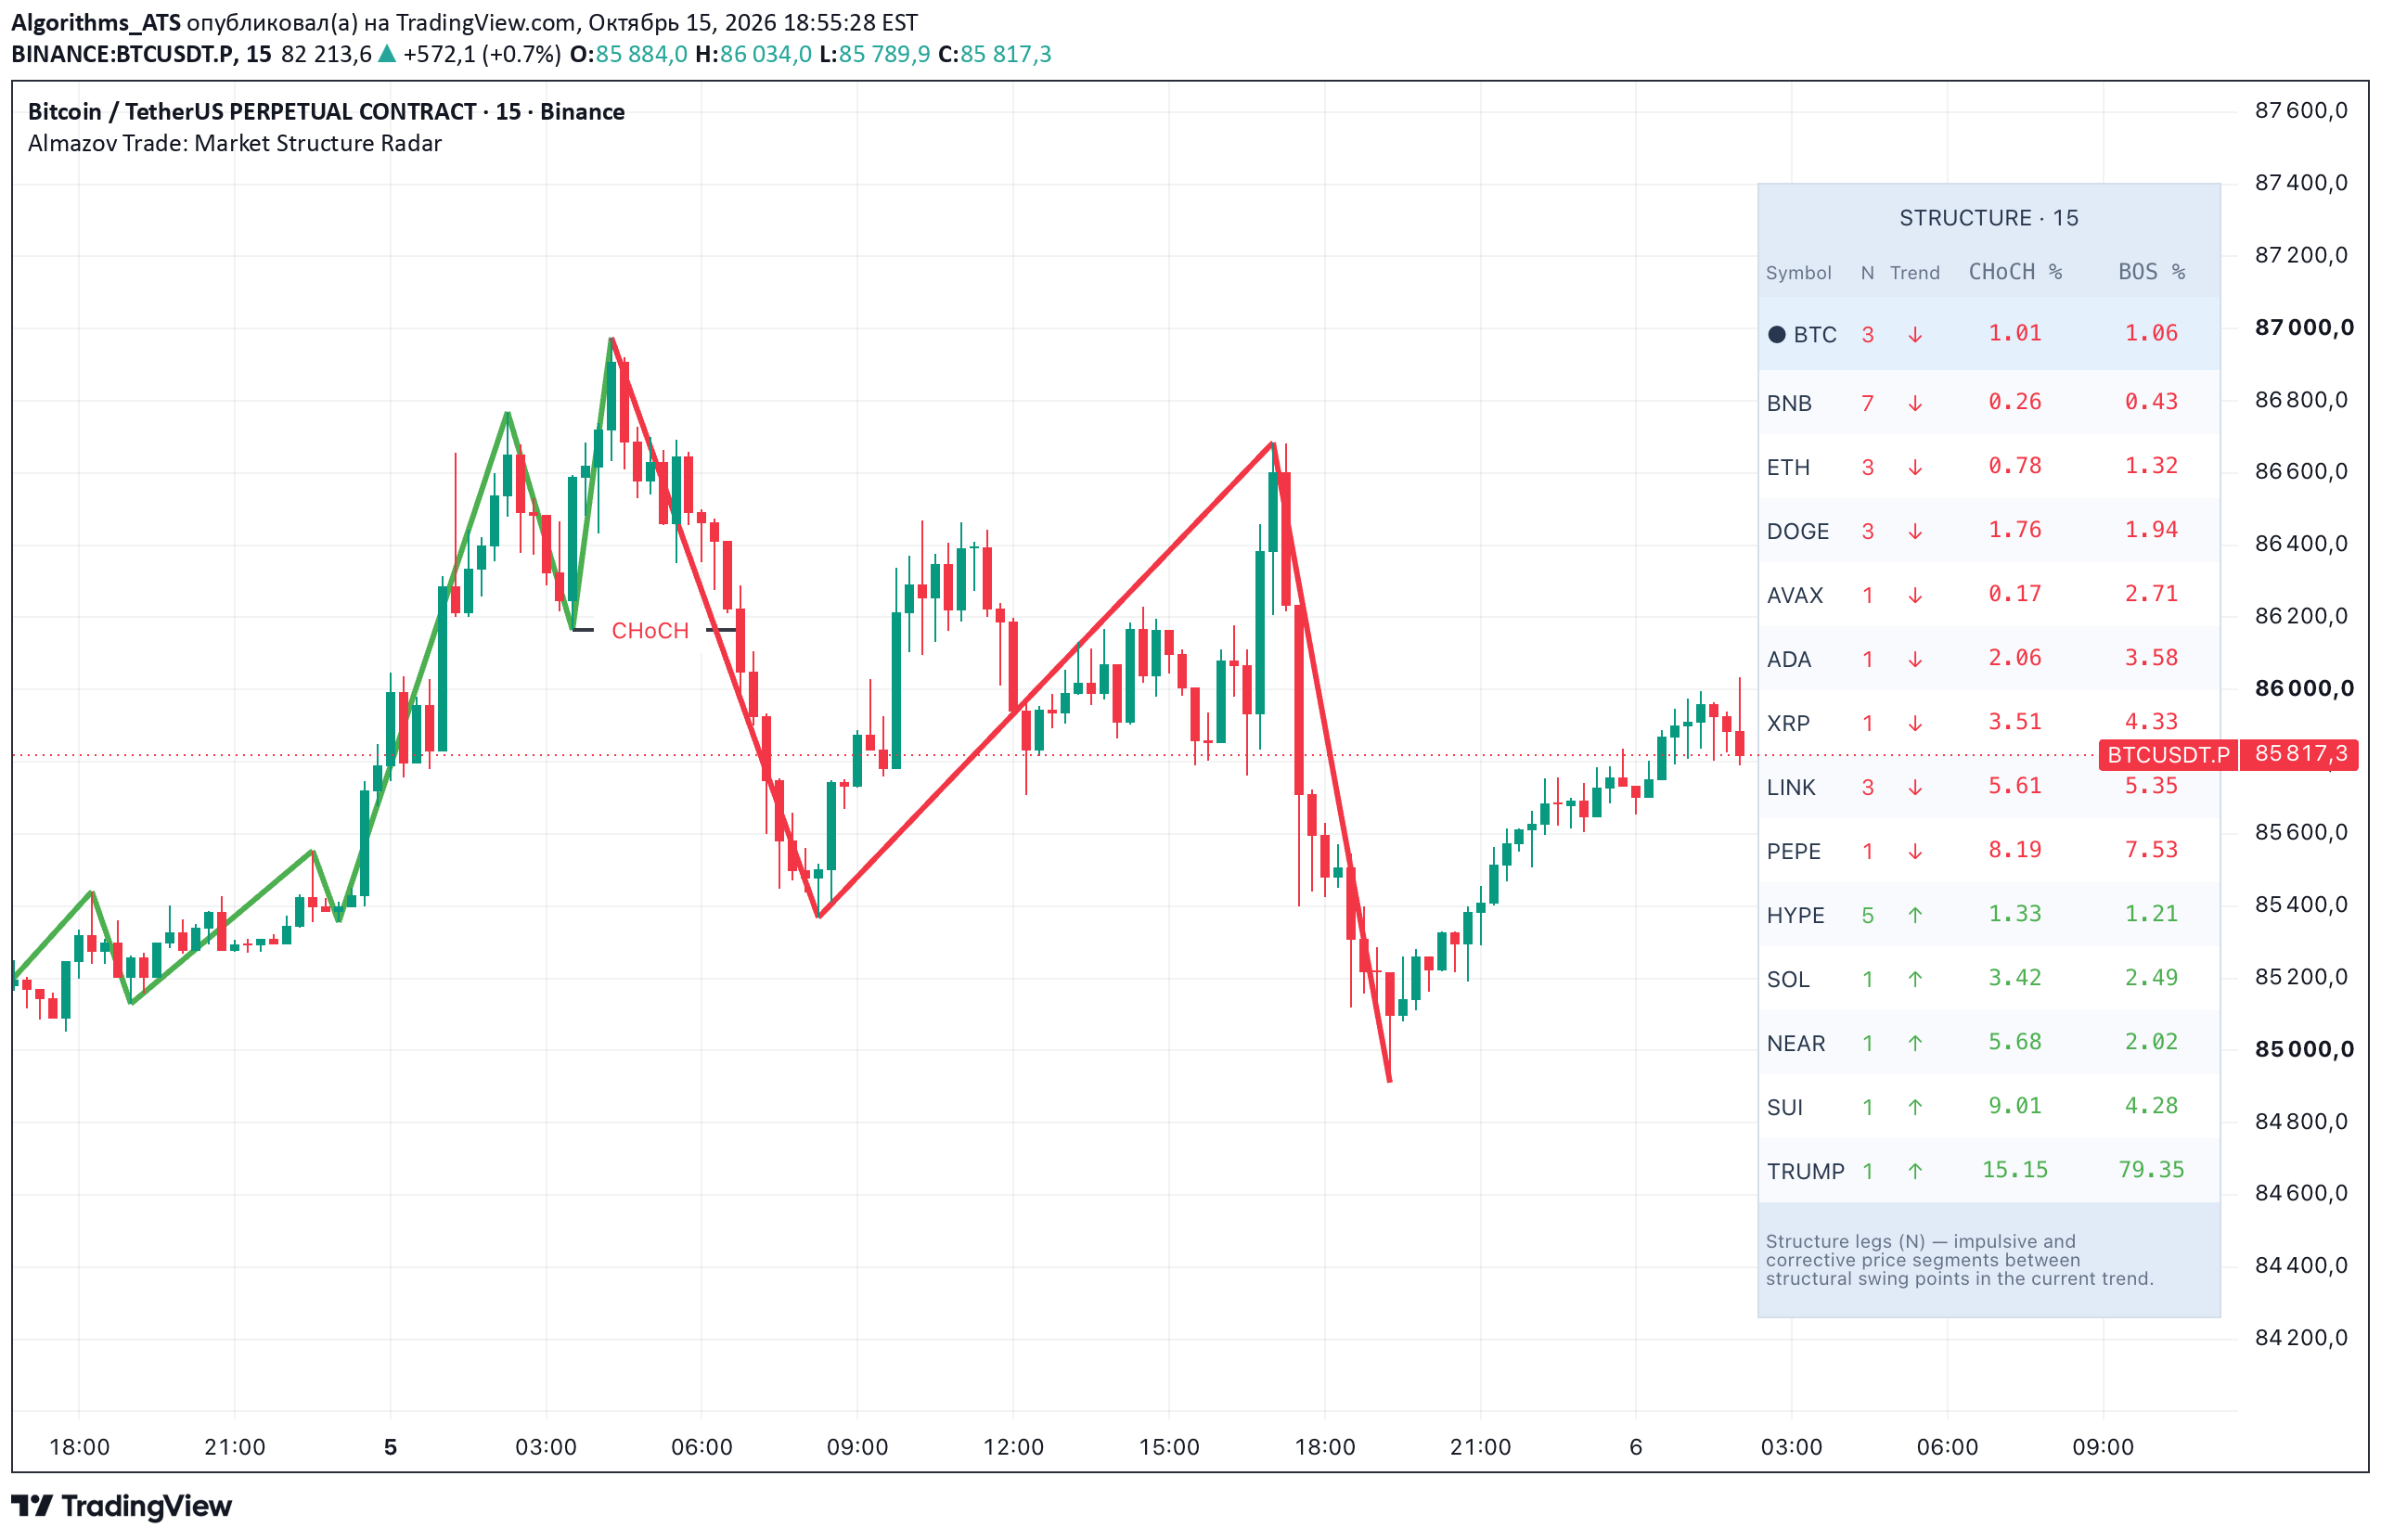
Which market is nearest to its next structural level?
The pinned first row sets the reference trend. Rows aligned with it rank by distance to a continuation level (BOS). Rows trending the other way rank by distance to a change-of-character level (CHoCH). Each symbol supplies its own price and structure.
Read the chart guideWhere the example stops
A smaller percentage means a smaller price distance. It does not estimate the odds of a break. Distances can move during a developing candle while the confirmed structural direction stays the same.
Compare with SMT Monitor