Free · TradingView
Structure
Trace connected price swings and identify the level where the market’s structure changed direction.
Open free script on TradingViewFree public script. The publication and its usage details are available on TradingView.
Publication revision 2
BINANCE:ETHUSDT.P · 15 min
Candles · UTC+3 · 20 – 25 Sept 2026
Author snapshot ·
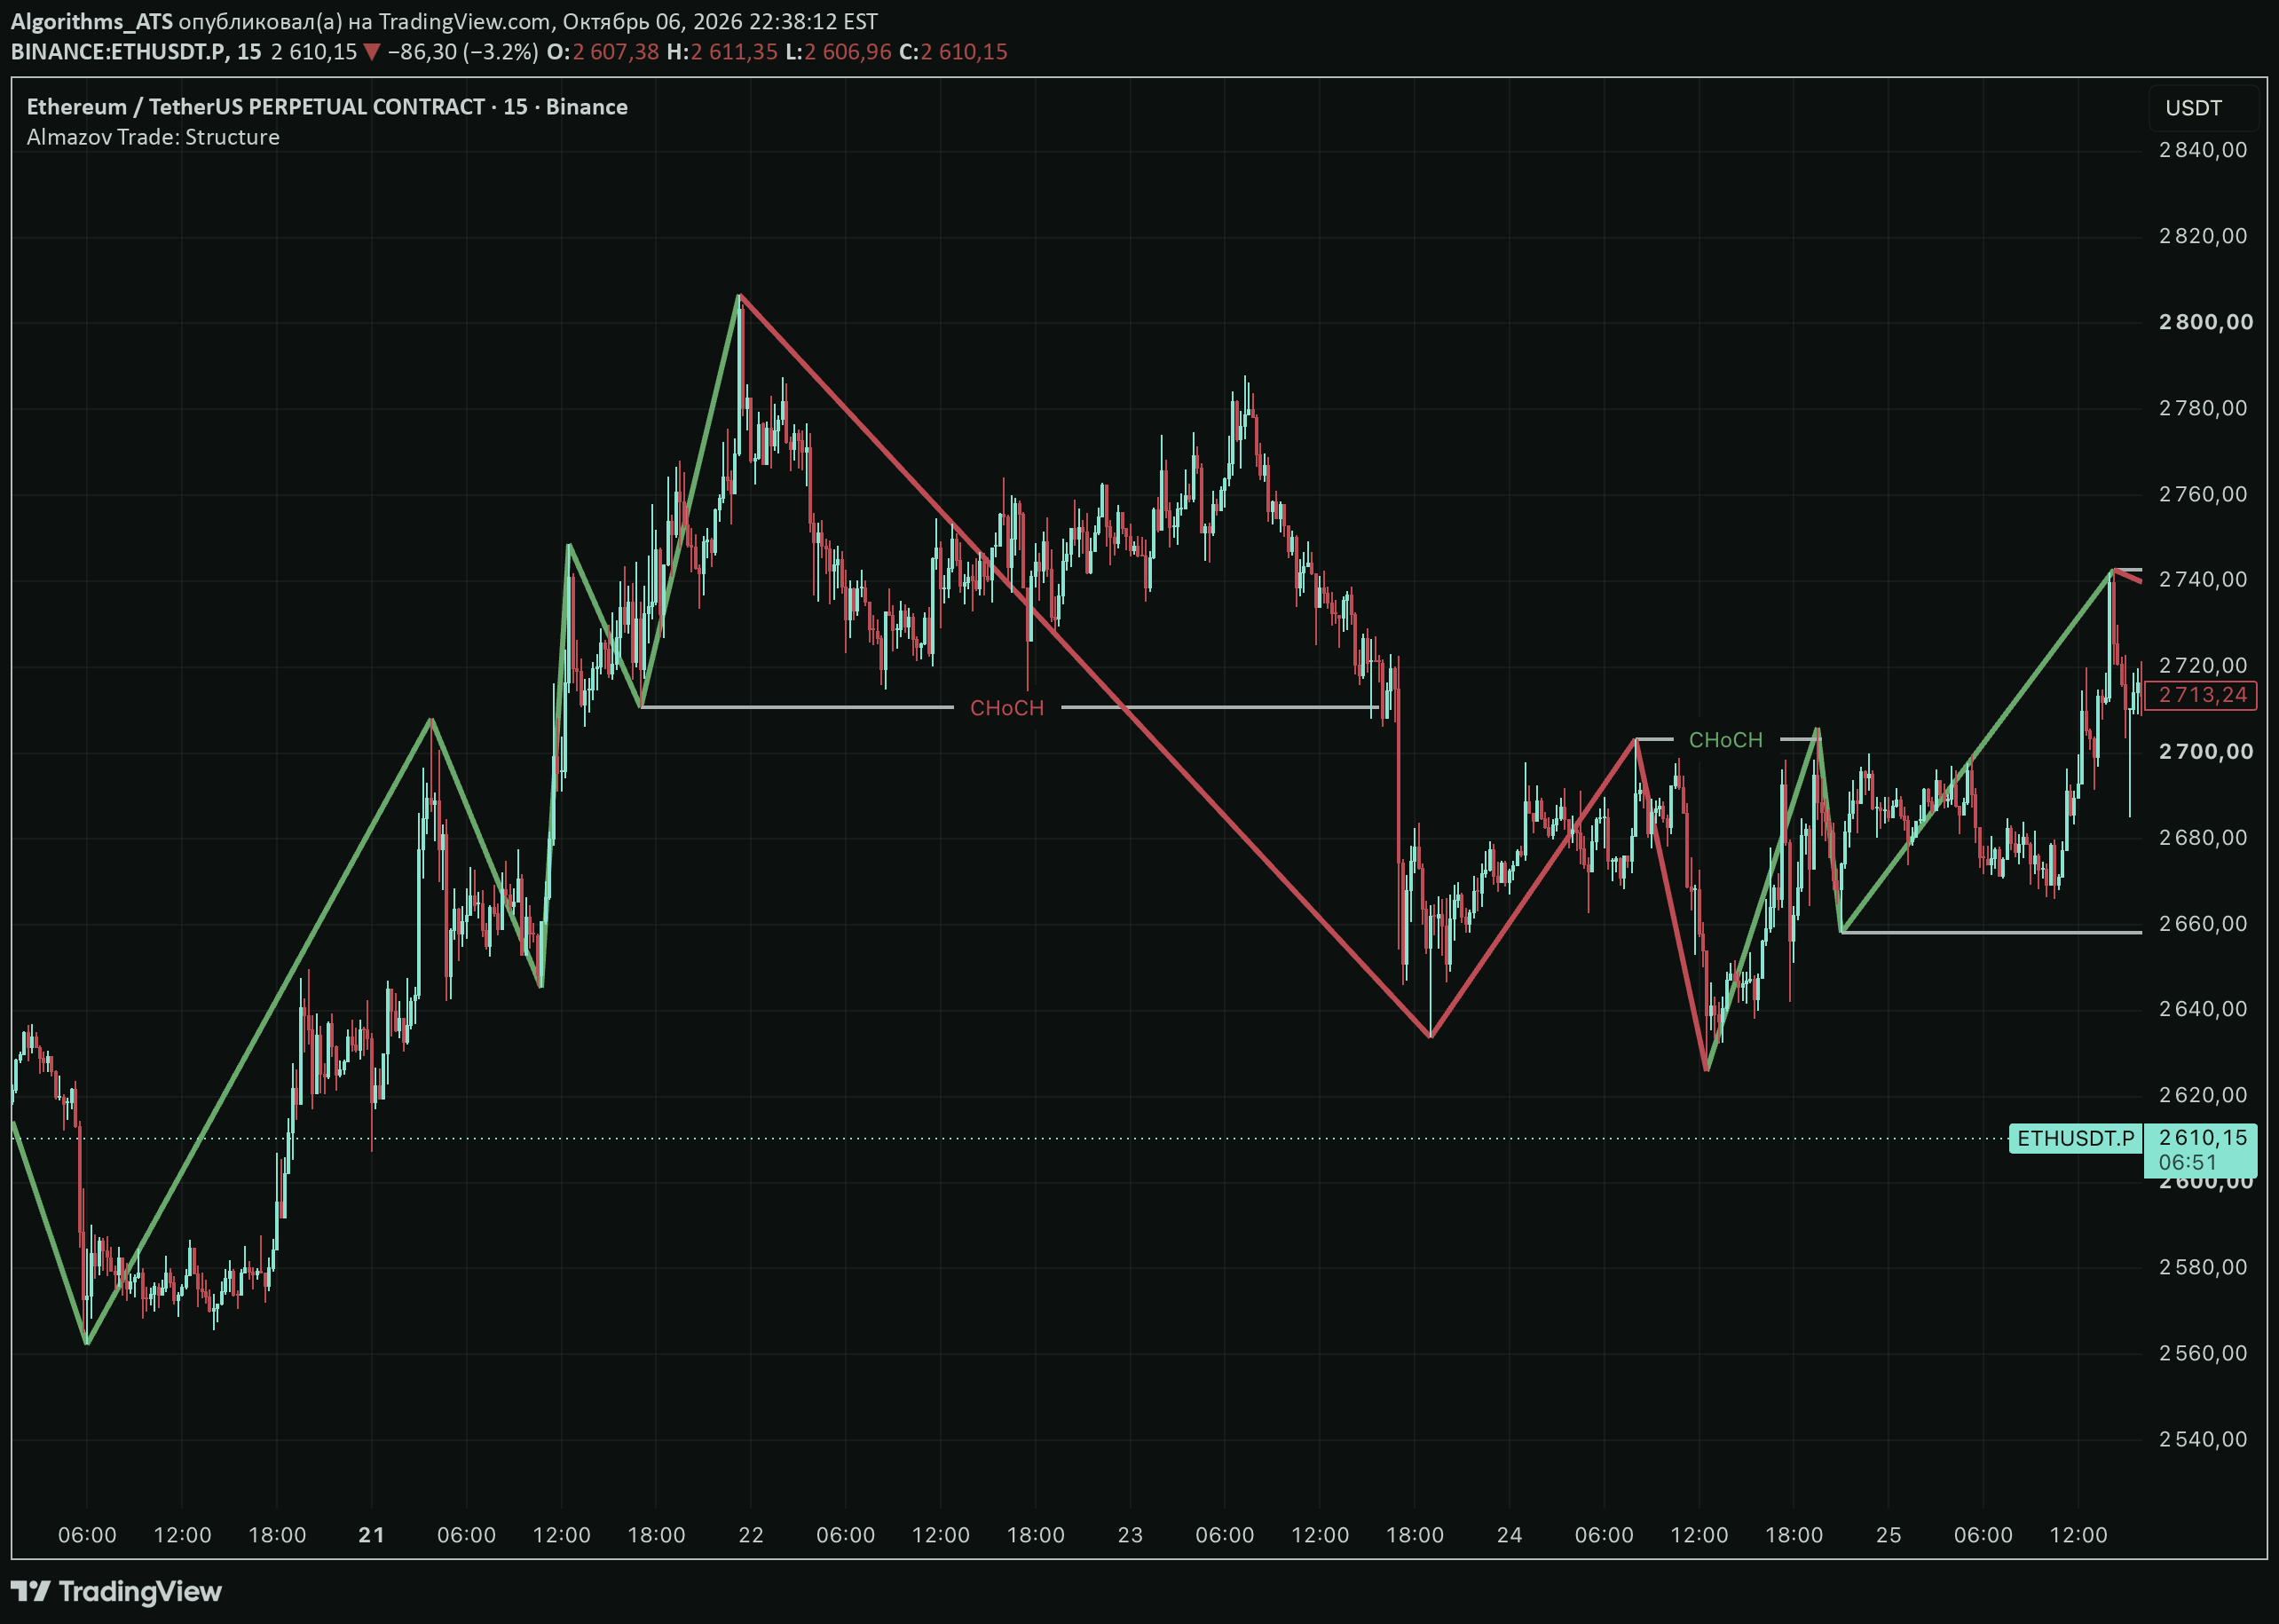
Green and red segments connect Ethereum swings. A horizontal break marked CHoCH crosses the old structure before the next downswing.
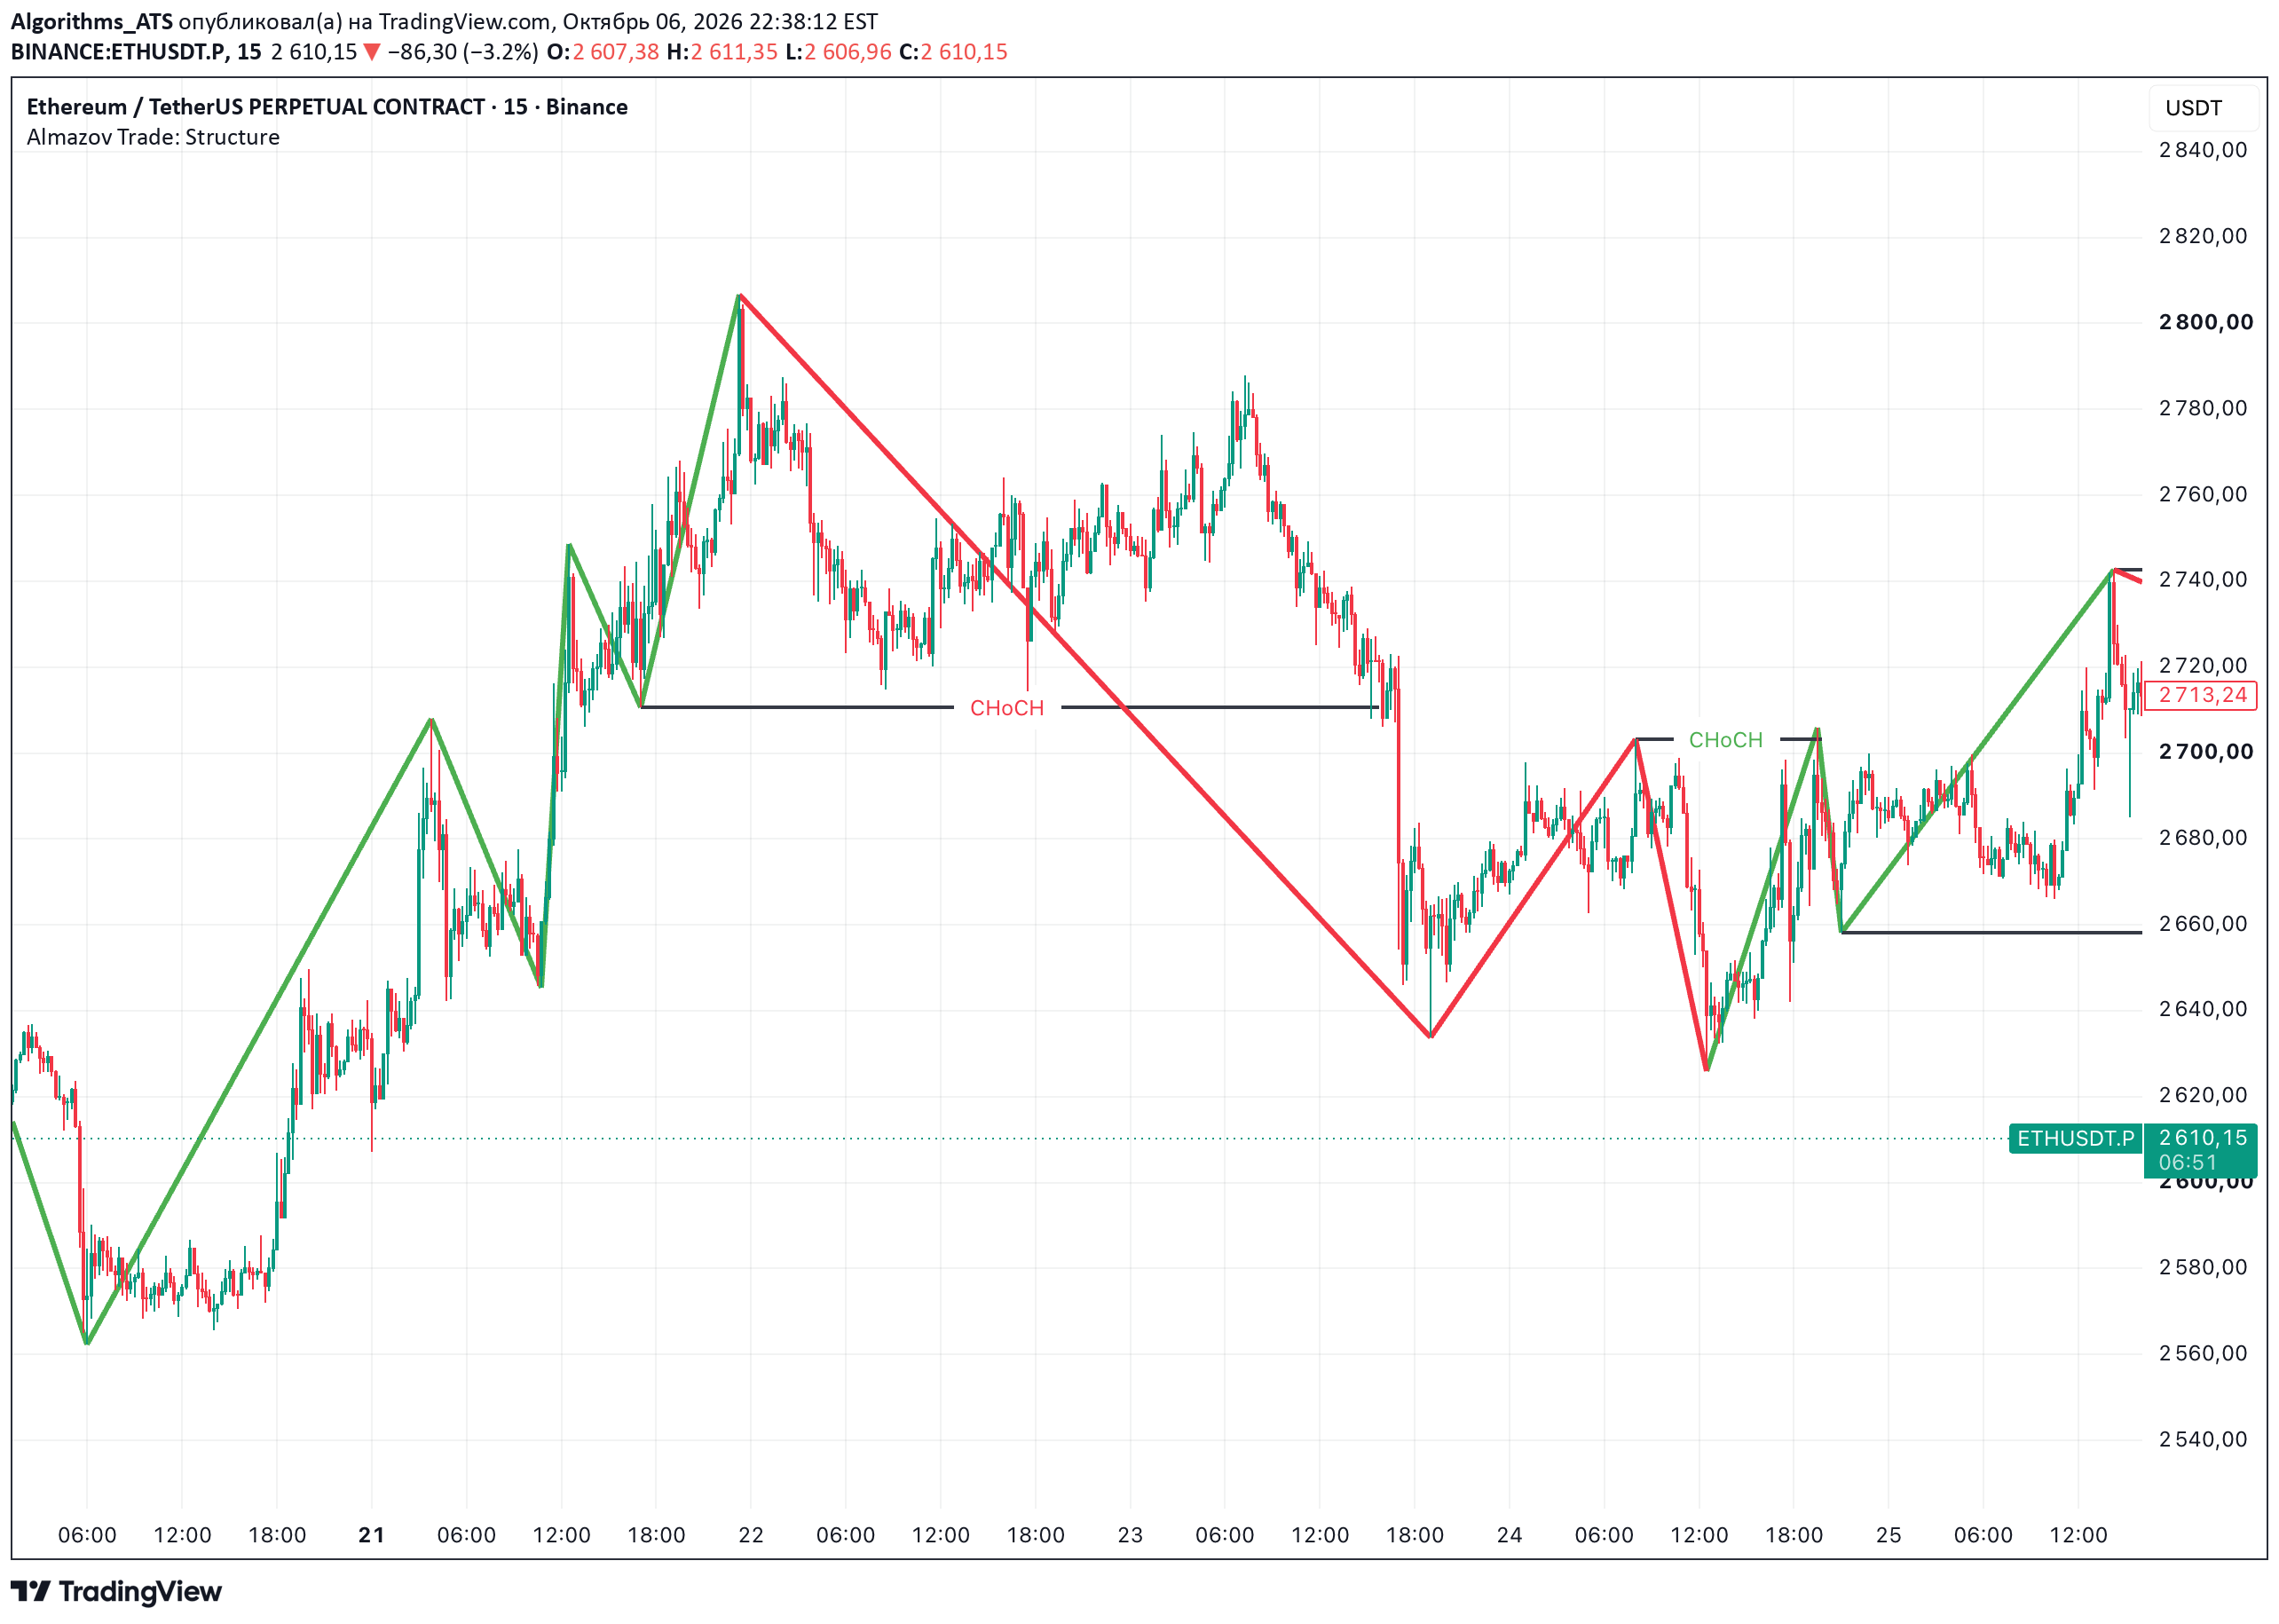
Which swing actually changed the market structure?
Structure builds bars on the selected timeframe and anchors each turn to the chart candle that supplied its extreme. A new high extends a bullish leg until a valid intervening low can separate two legs. A break of the protected low changes the direction.
Read the chart guideWhere the example stops
The line is drawn back to the extreme once the swing is confirmed. On a higher calculation timeframe, the chart can cross the protected level before the larger bar closes and the CHoCH appears.
Watch the related lessonExplore Market Structure Radar to compare the structure of selected symbols in one table.
Compare with Market Structure Radar