BINANCE:BTCUSDT.P · 10 min
Candles · UTC+3 · 31 Aug – 1 Sept 2026
Author snapshot ·
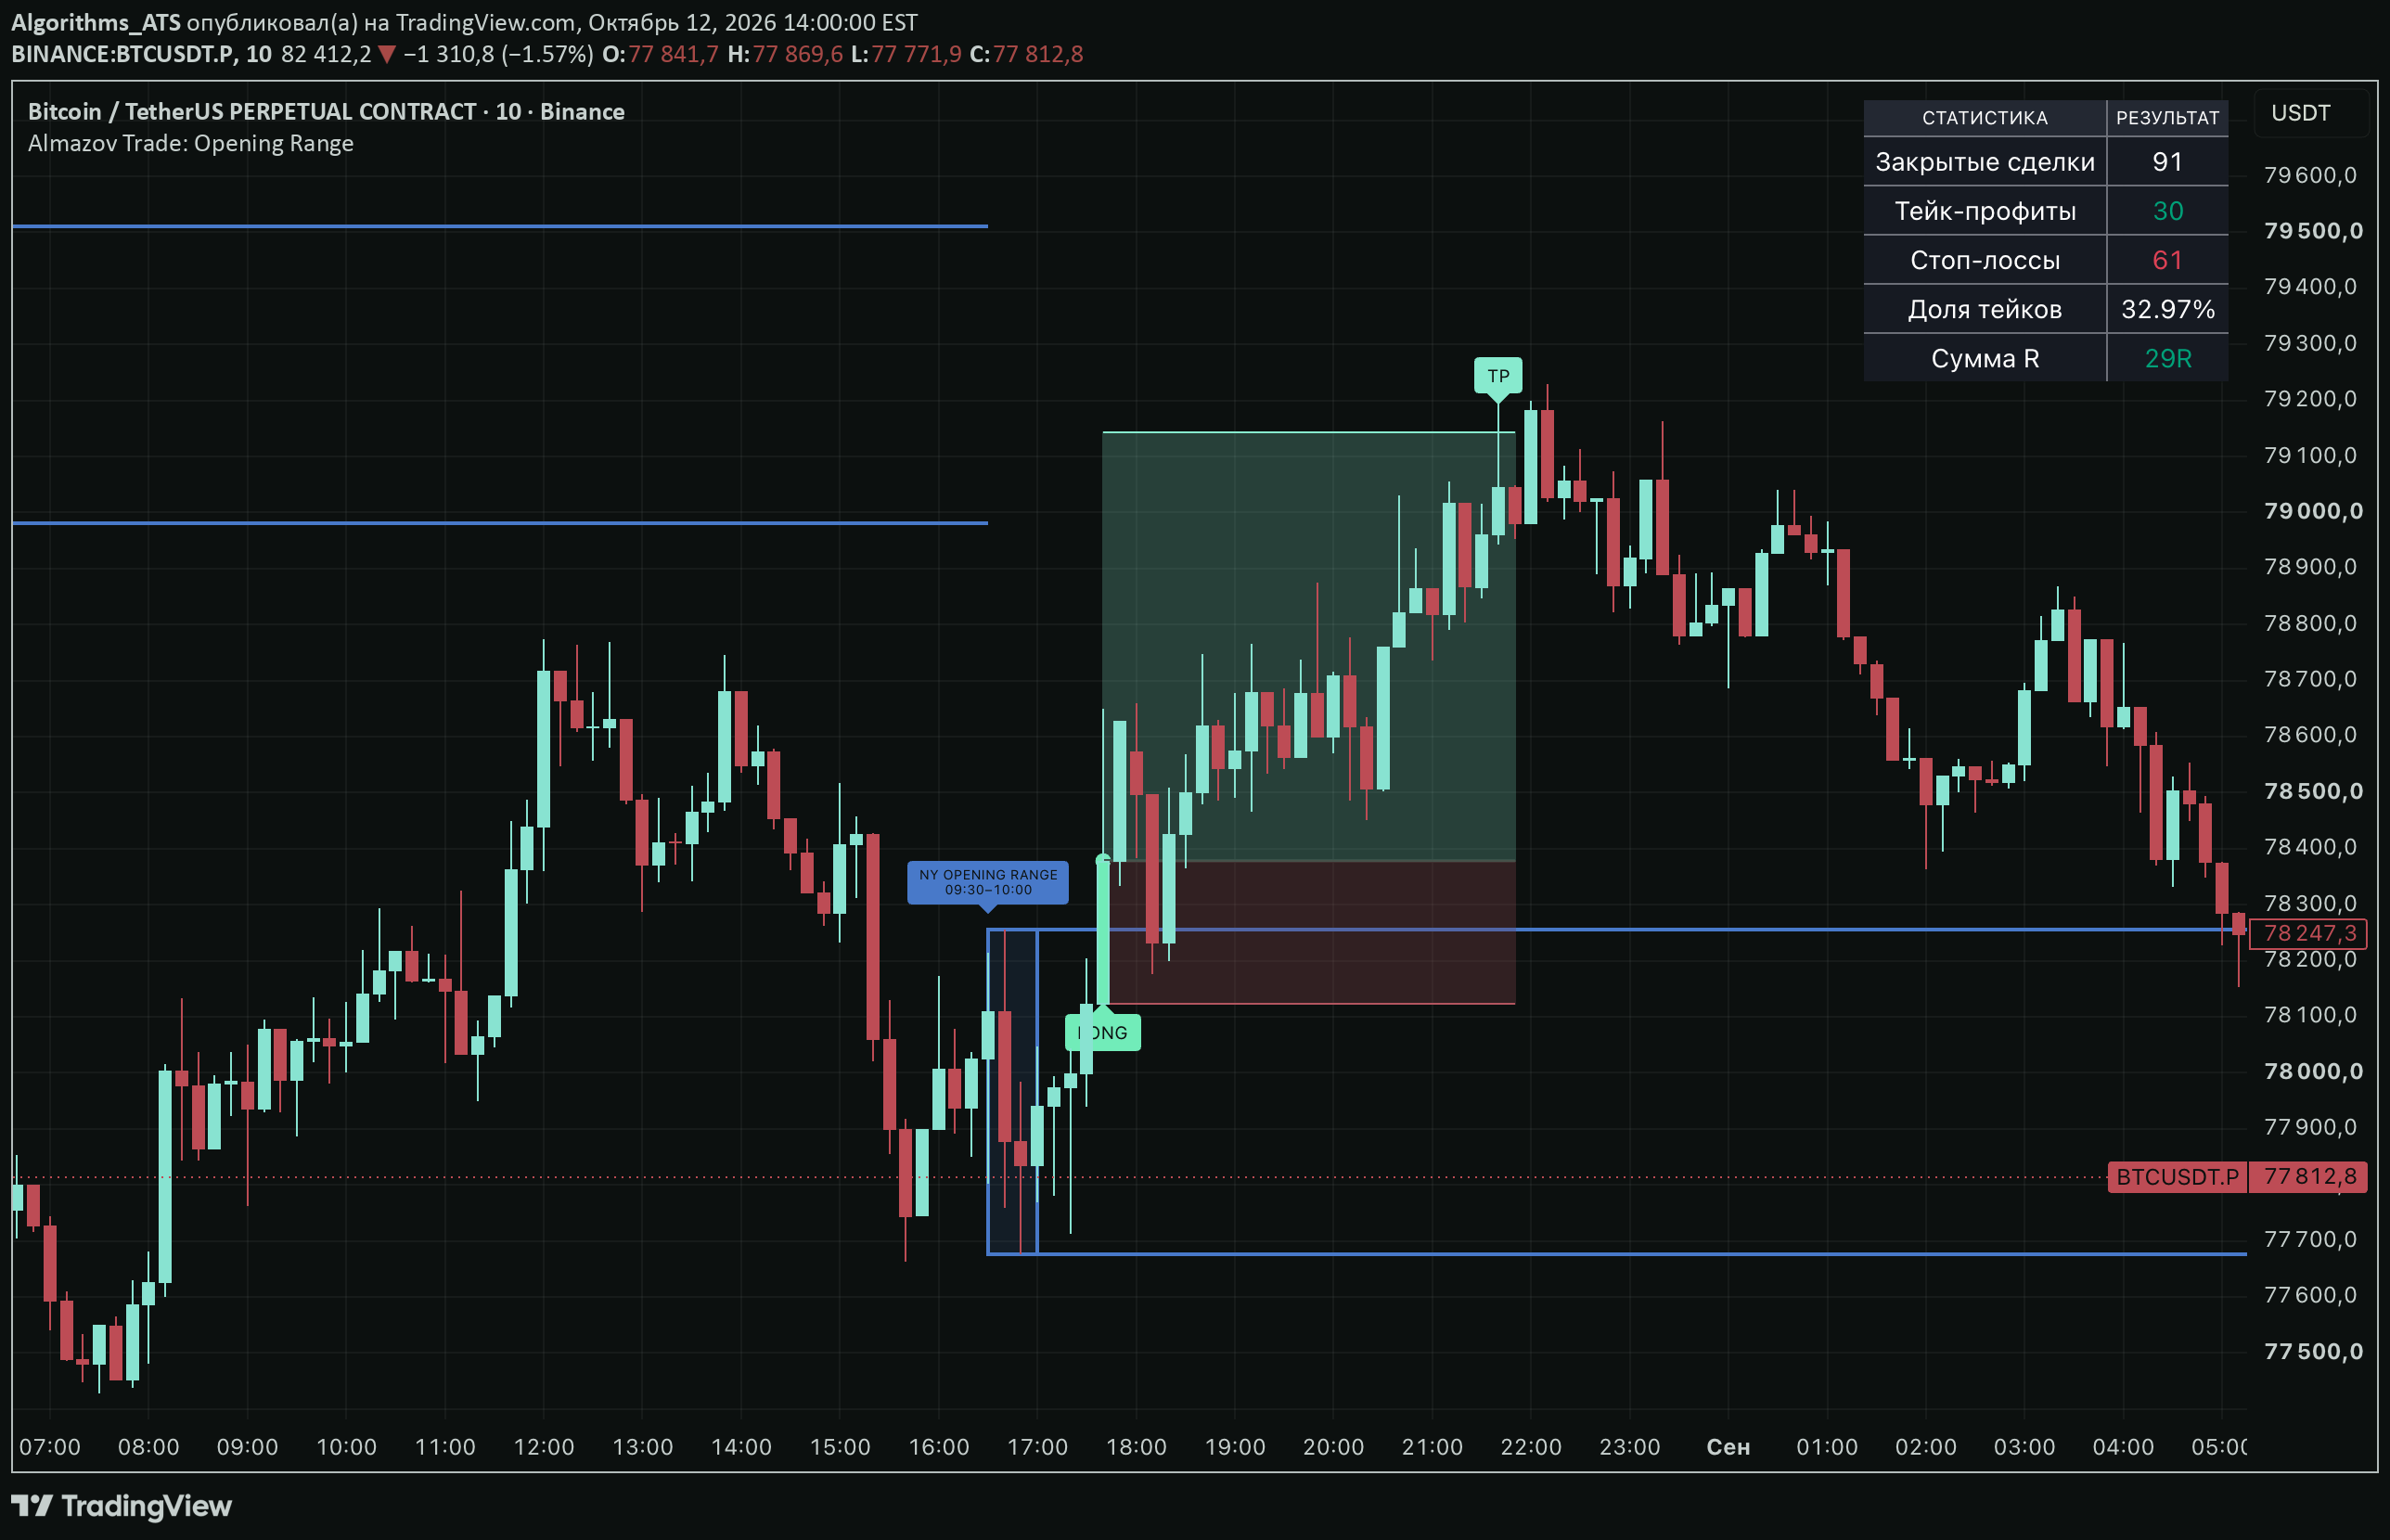
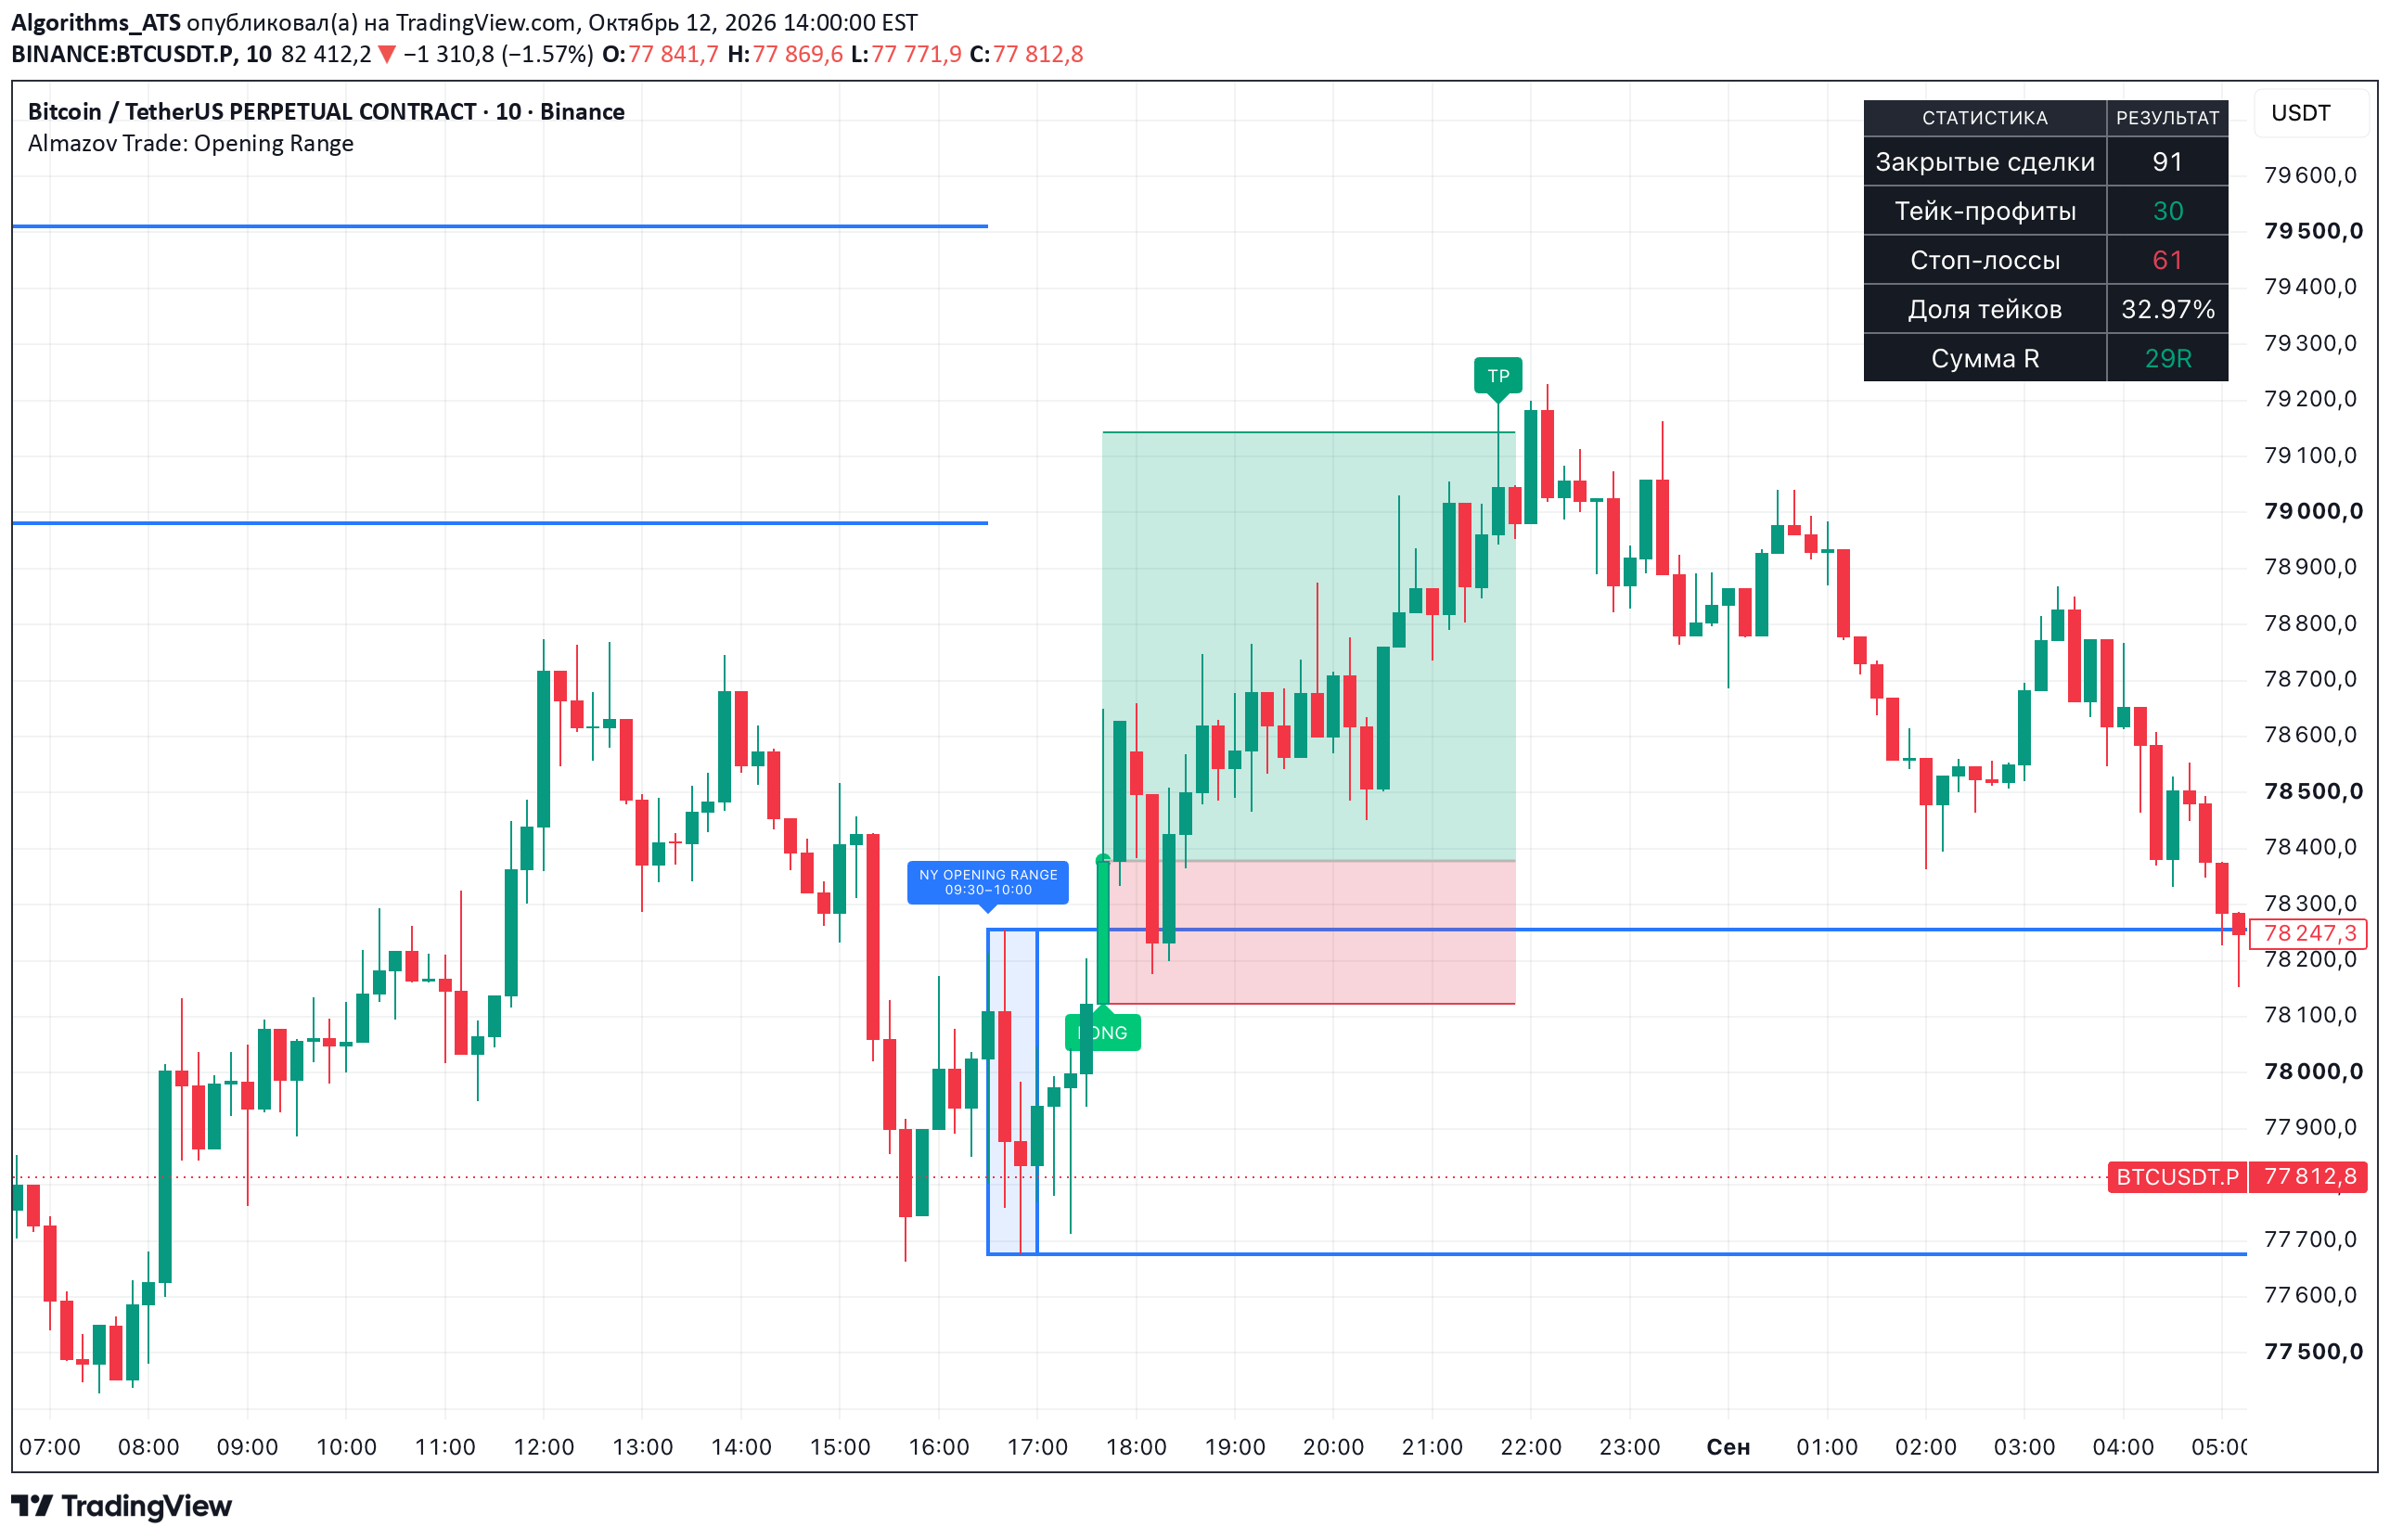
The blue New York range ends before the LONG marker. The green target area reaches the candle marked TP. The red area below entry shows the modelled stop distance.
Build the reference range
Accumulate the high and low of the weekday 09:30–10:00 session in America/New_York. On a correctly aligned ten-minute chart that takes three consecutive candles. A gap in the range invalidates that session.
Choose the first qualifying candle
After 10:00, require a close strictly above the upper line for a long, or strictly below the lower line for a short. An equal close and a wick alone both fail. The breakout close is the model entry. The opposite extreme of that candle sets its stop distance.
Account for an ambiguous exit
The default target is three times that distance. Exit checks begin on the next candle. If both the target and the stop fit inside one later candle, OHLC data cannot reveal the order. The model counts that candle as a stop. The resulting gross R omits fees, spread and slippage.