From a chart pattern to a measurable feature
In April 2025, we examined a wick parameter using a working sample of 5,000 order blocks. The discussion went beyond comparing a few successful chart examples: observations were sorted by the parameter and grouped for analysis.
This changes the question. Instead of asking whether an individual block looks convincing, we investigate how a defined feature separates groups of events and how the model behaves within them.
Selection quality and event frequency belong together
The working discussion considered both parameter intervals and the number of trades they would leave available. A narrow selection can look attractive while changing the amount and composition of evidence behind the conclusion.
That makes the selection rule part of the experiment. Definitions, the instrument, the period and the events admitted to the sample need to remain identifiable when configurations are compared.
What this work establishes
The development history records an actual sample-based investigation and a comparison of parameter groups. The original sample and a complete numerical report have not been reproduced in this publication; the historical percentage improvement is therefore not presented here as a validated result.
Order Block Atlas [MTF] is our current tool in this subject area. Its proprietary parameters were selected on more than six years of history, as described by the owner. The earlier 5,000-event study is a separate research episode; its results are not assigned to the current indicator.
Order blocks in a current tool
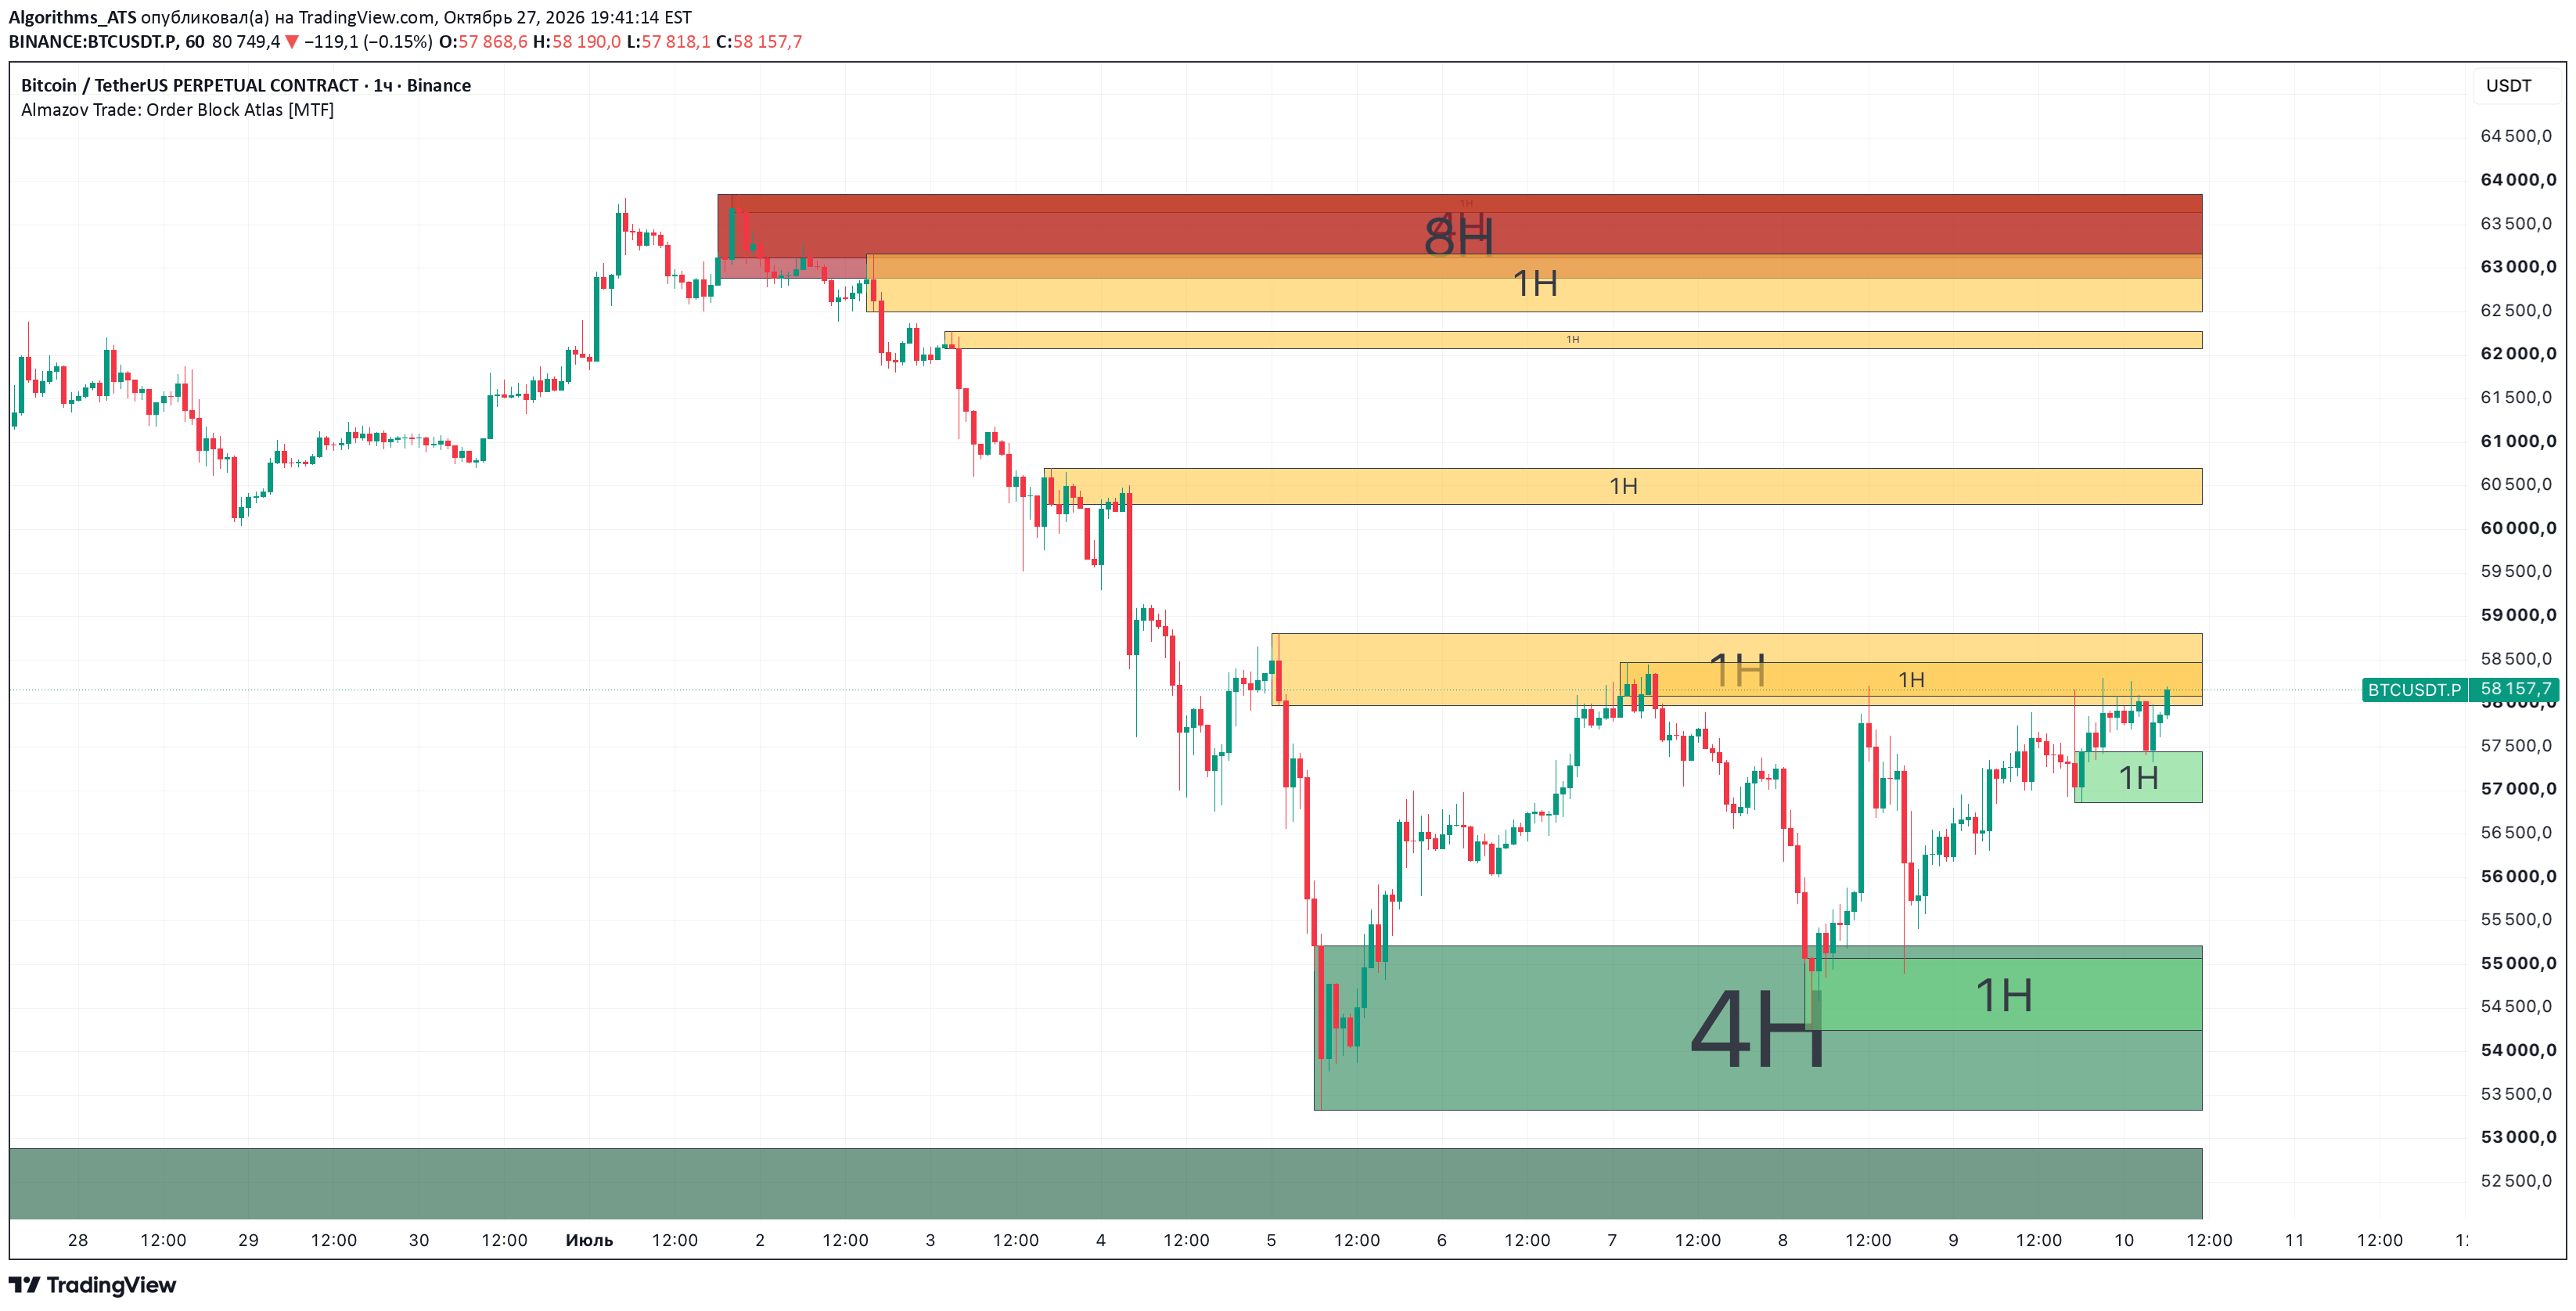
The current Order Block Atlas [MTF] illustrates the product subject. This chart is separate from the archived sample of 5,000 observations.
BINANCE:BTCUSDT.P · 60 min
Candles · UTC+3 · 27 Jun – 10 Jul 2024
Author snapshot ·
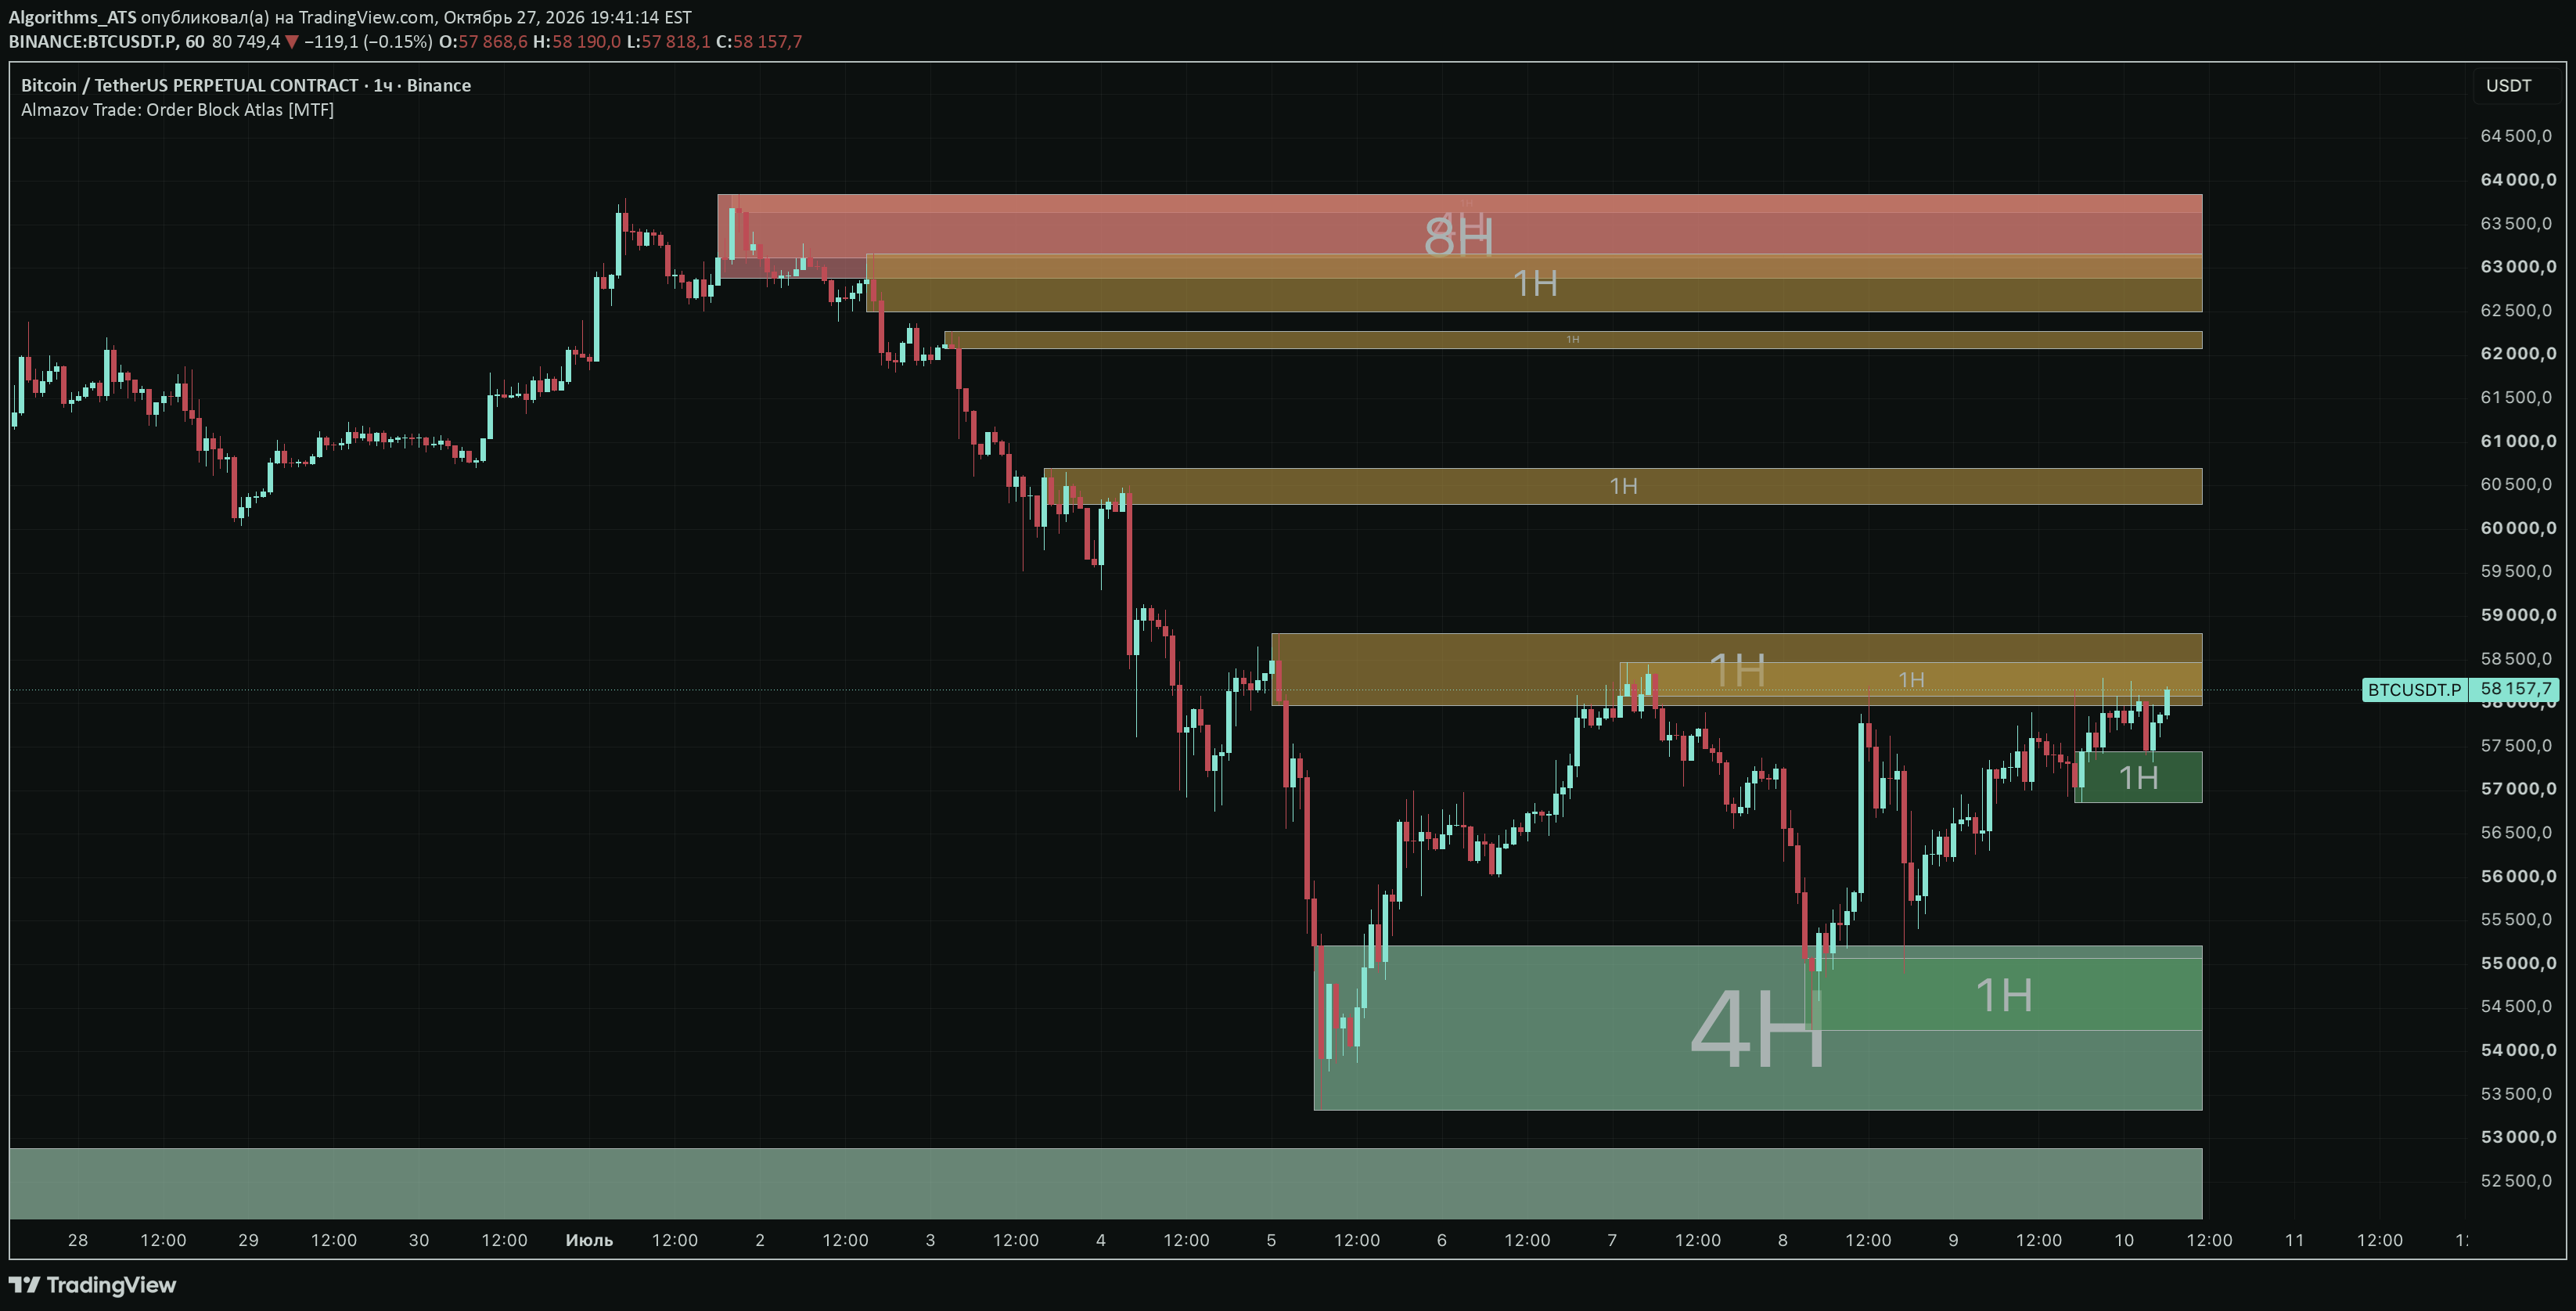
The BTC chart shows stacked short zones overhead and long zones below. The printed 1H and 4H labels identify the calculation intervals of the blocks.